Infographics done right can deliver clear and concise information. They don’t have to be fancy as not everyone is a graphic designer, but that is always a nice bonus. However, with all the sharing on social networks, we end up forgetting our audience.
Not all of your audience wants to download a graphic just to view an image. Not all of your audience wants to read a graphic chock full of wall to wall information.
If you are not writing a post in depth about the infographic, then the search engine won’t be able to do much for your graphic. On the other hand, too much information doesn’t need to be put in graphic form when you have plenty of room on your site that a search engine can easily pick up the content.
So what kind of happy medium can you come to when creating or even considering to share an infographic? Your besdt bet is to use the K.I.S.S. method (Keep it Simple, Stupid.) I’ve created an Infographic on infographics that is short and sweet, just like an infographic should be.
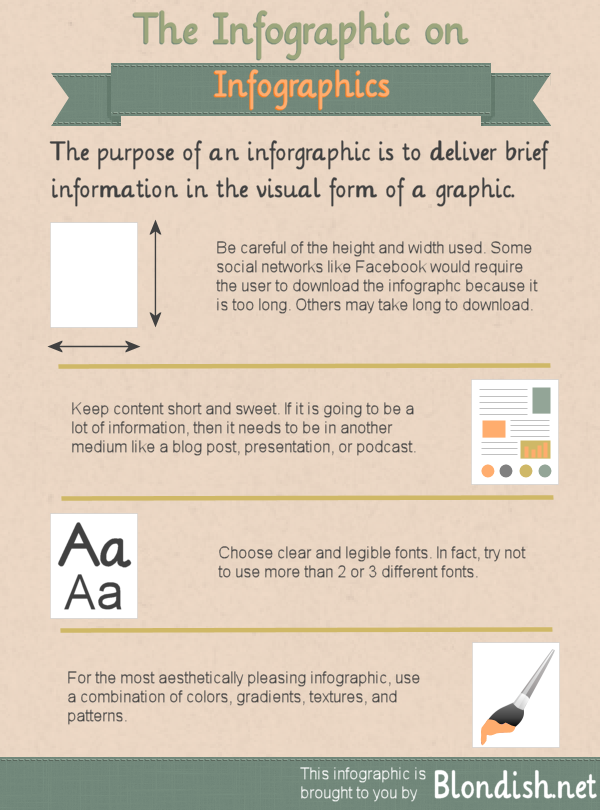
The Infographic On Infographics
Hey Nile! Not to toss a grenade on your blog, but I keep reading that the revised Google search engine parameters do not look kindly on blogs posting infographics. Moreover, I have over 6 THOUSAND posts on my blogspot blog many of them are really unique and incredible. Sorry to say Google only sees the ones I consider CRAP! Time after time, the great stuff the mighty search engine is supposedly seeking doesn’t even register with them! I’ve decided it may be better to just forget about Google, Bing and their ilk – forget about watching the stats and trying to boost worthwhile articles with a little extra ping.
Hi Dave! It depends on how the infographic is posted. If it is just the image… then yes, that is a problem. However, if it is accompanied by text, there are no problems. Don’t worry Dave… I’ve been doing this for 12 years. 😉
@Dave: you should also look at them as linkbait. That cant harm your site.
Anything thoughts on the quality of the inforgraphic builder websites out there? I played with one and while I didn’t think the quality was great it was a lot better than something I could cook up in photoshop myself.
Hi Adam! I don’t use a builder. I do my own. The ones I have seen, really don’t inspire me to want to use them, but they can help for those who can’t create graphics.
The Infographic submission is most popular way introduce the products.
Never done one infographic but maybee it’s time to try it!
Infographics are in these days. You just have to use it precisely. Must try.
Hi Nile,
do you happen to know any free on-line infographic tool?
Thank you!
Hi Amanda! Piktochart seems to be a promising place – http://piktochart.com/
Cool infographic on infographics. There are many free tools online to create infographics but not all of them are good. Piktochart looks good. Gonna give it a try.
Piktochart is good. This graphic though, I created myself without a third party application.
Hi Nile,
great example of an infographic demonstrating how to best construct one.
Somewhere I learned that the average attentions span is upto 20 seconds.
Breaking information up into ‘bit size’ with images supporting the message makes sense and is more likely to keep people reading.
Much appreciated!
Yorinda
Definitely… while I’ve seen some great infographics, many of them are way too long and have way too much information to even spending time reading. I really don’t have that type of time and I know many others don’t either.
hi thanks for this post too much information doesn’t need to be put in graphic form when you have plenty of room on your site that a search engine can easily pick up the content
Exactly. 😀
Hi Nile,
What I absolutely love here is that you’ve created a little how-to, something not often done with infographics, instead of simply listing some stats. Thanks for sharing this post with the BizSugar community. Hopefully, it will encourage a lot more content creators to get involved with infographics in the future.
Hi Heather! Thanks! A lot of people think that jamming a ton of information is key, but if we did that on billboards on roads and other signs, we’d obviously have problem. The KISS method should apply to infographics.
People want their information fast and easy. It makes for a faster and larger impact that chewing a bunch of facts that may not even draw a reaction from the viewer.
Nile, I just started to notice info-graphics! I have never done one but I am thinking of doing one soon! I really like them because they compress lot’s of info on one page!
This is refreshing to read. I like your infographic. Simple. To the point. Clear. That’s what I like.